Data Quality and Preparation
Exploratory Data Analysis (EDA)
There are a number of powerful tools like Pandas Profiling and SweetViz that can make EDA fast and repeatable.
Pandas Profiling
Pandas Profiling is an automated EDA tool that generates rich HTML reports from pandas dataframes. It can be a very nice way to show early progress to a customer when doing data engineering.
SweetViz
SweetViz is a visualisation tool for Python that generates comparisons of data frames. The primary use case is comparison of test and train sets to ensure that they are similar but it could be used for other purposes such as comparing annotated data from different sources.
Assessing Data Quality
One of the biggest difficulties with ML is dealing with messy data. This is a common and reoccurring problem.
CleanLab
CleanLab is a product that attempts to use statistical methods to clean up data and labels. I need to read more about exactly how it works.
They have some tutorials on how to use their system to clean up text for processing here
Variance
Variance essentially refers to how spread out your data is relative to its mean.
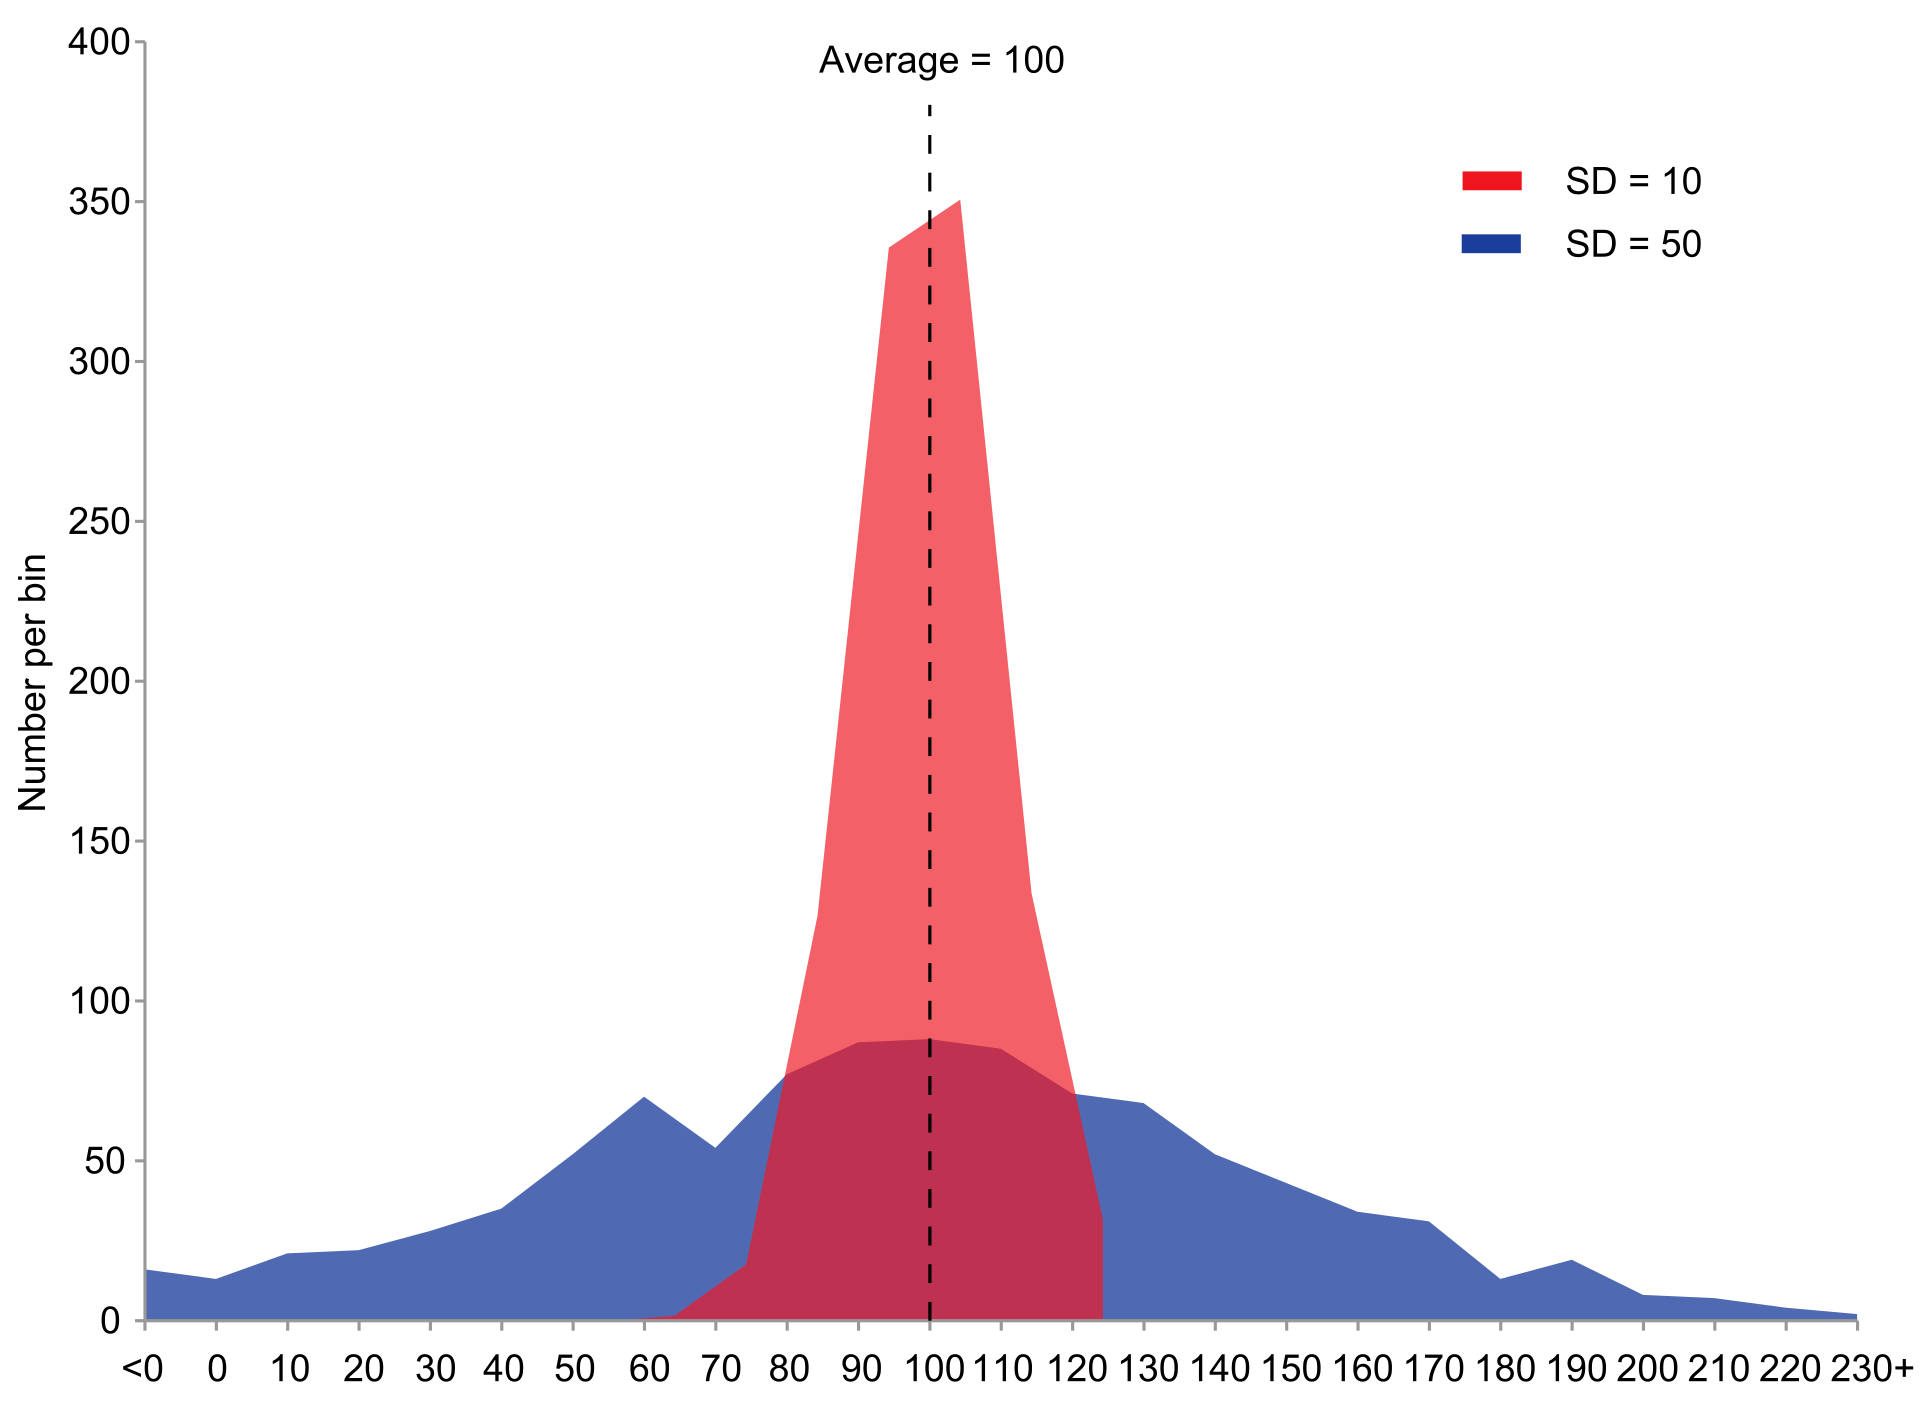
In the diagram the red distribution has low variance and the blue distribution has high variance.
In finance a probability distribution with high variance is typically seen as more risky (historical events have been very widely spread which implies that there is more chance that future events are more likely to fall across a much wider range).
Effects of Variance on ML Training Data
Data with high variance leads to less sensitive models and vice versa. This is really nicely illustrated in this blog post (mirror)
Effects of Variance on Machine Learning Models
Models with a high degree of variance (often strongly tied to the number of parameters in the model) often fit better to training data but struggle to generalise to test data and vice versa.